Thursday, April 05, 2018

Trace Design to Requirements

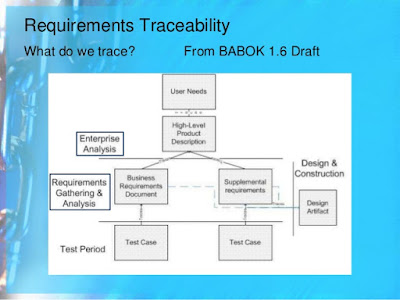
What do we trace for requirements traceability?   (Posted by Jerry Yoakum)

When designing software, the designer must know which requirements are being satisfied by each component. When selecting a software architecture, it is important that all requirements are "covered." After deployment, when a failure is detected, maintainers need to quickly isolate the software components most likely to contain the cause of the failure. During maintenance, when a software component is repaired, maintainers need to know what other requirements might be adversely affected.

All these needs can be satisfied by the creation of a table with rows corresponding to all completed software components and columns corresponding to every released requirement in the software requirements specification (SRS). A check in any position indicates that this design component helps to satisfy this requirement. Notice that a row void of checks indicates that a component has no purpose and a column void of checks indicates an unfulfilled requirement. Some people argue that this table is very difficult to maintain. I would argue that you need this table to design or maintain software. Without the table, you are likely to design a software component incorrectly, spending exorbitant amounts of time during maintenance. The successful creation of such a table depends on your ability to refer uniquely to every requirement.

----

STOP. Do not dismiss the above because it doesn't sound like an agile practice. There is nothing to stop you from creating, maintaining, and using the above table within the framework of scrum. This is really about design and documentation. Being able to document where work for specific requirements is to be, and was, done will drive development toward modular (in its many forms) design.

I have worked with development teams that track this.. kinda. The specification for a project is stored in JIRA with each issue representing each requirement. When an issue is marked resolved the issue is linked to the commit history, code review, and test documentation. It lacks a high-level view but a sufficiently large table would also suffer from the same difficulty. Anyway, it is immensely useful to be able to query JIRA for issues related to a specific feature and have a subset of commits to look at first.
Evaluate Alternatives

Cat choices  (Posted by Jerry Yoakum)


A critical aspect of all engineering disciplines is the elaboration of multiple approaches, trade-off analyses among them, and the eventual adoption of one. After requirements are agreed upon, you must examine a variety of architectures and algorithms. You certainly do not want to use an architecture simply because it was used in the requirements specification. After all, that architecture was selected to optimize understandability of the system's external behavior. The architecture you want is the one that optimizes conformance with requirements.

For example, architectures are generally selected to optimize throughput, response time, modifiability, portability, interoperability, safety, or availability, while also satisfying the functional requirements. The best way to do this is to enumerate a variety of software architectures, analyze (or simulate) each with respect to the goals, and select the best alternative. Some design methods result in specific architectures; so one way to generate a variety of architectures is to use a variety of methods.

Wednesday, April 04, 2018

Performance Analysis: The USE Method

For every resource, check utilization, saturation, and errors.  (Posted by Jerry Yoakum)


Blatant rip off of http://dtrace.org/blogs/brendan/2012/02/29/the-use-method/ with a small amount of simplification.


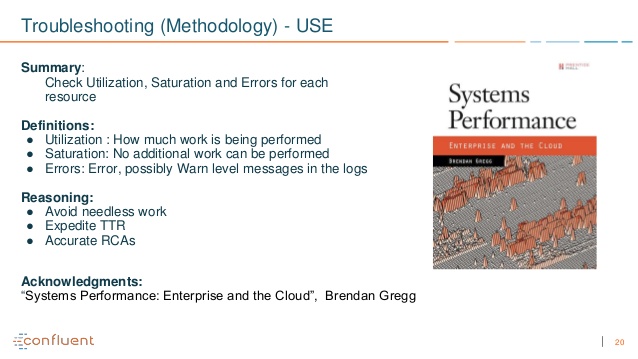
The USE method can be summarized as: For every resource, check utilization, saturation, and errors. While the USE method was first introduced to me as a method for examining hardware some software resources can be examined with this methodology.
Utilization is the percentage of time that the resource is busy working during a specific time interval. While busy, the resource may still be able to accept more work; the degree to which it cannot do so is identified by saturation. That extra work is usually waiting in a queue.

Saturation happens when a resource is fully utilized and work is queued. When a resource is fully saturated then errors will occur.

Errors in terms of the USE method refer to the count of error events. Errors can degrade performance and might not be immediately noticed when the failure mode is recoverable. This includes operations that fail and are retried, as well as resources that fail in a pool of redundant resources.
The key metrics of the USE method are ususally expressed as:
  • Utilization as a percentage over a time interval.
  • Saturation as a wait queue length.
  • Errors as the number of errors reported.
It is also important to express the time interval for the measurement. A short burst of high utilization can cause saturation and performance issues, even though the overall utilization is low over a longer interval.

The first step in the USE method is to create a list of resources. Try to be as complete as possible. Here is a generic list of hardware resources:
  • CPUs - Sockets, cores, hardware threads (virtual CPUs).
  • Main memory - RAM.
  • Network interfaces - Ethernet ports.
  • Storage devices - Disks.
  • Controllers - Storage, network.
  • Interconnects - CPU, memory, I/O.
If focusing on software you should start out breaking your system down by services then methods then low level resources, for example:
  • Mutex locks - Utilization may be defined as the time the lock was held, saturation by those threads queued waiting on the lock.
  • Thread pools - Utilization may be defined as the time threads were busy processing work, saturation by the number of requests waiting to be serviced by the thread pool.
  • Process/thread capacity - The current thread/process usage vs the maximum thread/process limit of a system may be defined as utilization; waiting on allocation may indicate saturation; and errors occur when the allocation fails.
  • File descriptor capacity - Same as above but for file descriptors.
Drawing a function block diagram for the system will be very helpful when looking for bottlenecks in the flow of the data. While determining utilization for the various components, annotate each one on the functional diagram with its maximum bandwidth. The resulting diagram may pinpoint systemic bottlenecks before measurement has been taken. (This is a useful exercise during product design, while you have time to change specifications.)

Here are some general suggestions for interpreting metric types:
  • Utilization - 100% utilization is usually a sign of a bottleneck (check saturation and its effect to the confirm). High utilization (i.e. >60%) can begin to be a problem. When utilization is measured over a relatively long time period, an average utilization of 60% can hide short bursts of 100% utilization.
  • Saturation - Any amount of saturation can be a problem. This may be measured as the length of a wait queue or time spent waiting on the queue.
  • Errors - Non-zero error counters are worth investigating, especially if they are still increasing while performance is poor.

Design Without Documentation Is Not Design

Cart before the horse.  (Posted by Jerry Yoakum)

Sometimes you'll hear a software engineer say, "I have finished the design. All that's left is its documentation." This makes no sense. Can you imagine a building architect saying, "I have completed the design of your new home. All that's left is to draw a picture of it," or a novelist saying, "I have completed the novel. All that's left is to write it"? Design is the selection, abstraction, and recording of an appropriate architecture and algorithm onto paper or other medium.

Wednesday, August 23, 2017

Encapsulate

The encapsulation of cat location.  (Posted by Jerry Yoakum)


Information hiding is a simple, proven concept that results in software that is easier to test and easier still to maintain. Most software modules should hide some information from all other software. This information could be the structure of data; the contents of data; an algorithm; a design decision; or an interface to hardware, to a user, or to another piece of software. Information hiding aids in isolating faults because, when the hidden information becomes unacceptable in some manner (such as when it fails or it must be changed to accommodate a new requirement), only the piece of software hiding that information need be examined or altered. Encapsulation refers to a uniform set of rules about which types of information should be hidden. For example, encapsulation in object-oriented design usually refers to the hiding of attributes (data) and methods (algorithms) inside each object. No other objects may affect the values of the attributes except via requests to the methods.


Reference:
Parnas, D., "On the Criteria to Be Used in Decomposing Systems into Modules," Communications of the ACM, December 1972.

Tuesday, April 25, 2017

Don't Reinvent the Wheel

Sometimes it's okay to copy.  (Posted by Jerry Yoakum)


When electrical engineers design new printed circuit boards, they go to a catalog of available integrated circuits to select the most appropriate components. When architects design homes, they go to catalogs of prefabricated doors, windows, moldings, and other components. All this is called "engineering." Software engineers usually reinvent components over and over again; they rarely salvage existing software components. It is interesting that the software industry calls this rare practice "reuse" rather than "engineering."

Sunday, January 15, 2017

Magic Square Corollary

The following definition for a Magic Square series is from the EDU-BLOG:
In recreational mathematics, a magic square of order ‘n’ is an arrangement of n2 numbers, usually distinct integers, in a square, such that the n numbers in all rows, all columns, and both diagonals sum to the same constant.  A normal magic square contains the integers from 1 to n2. The term “magic square” is also sometimes used to refer to any of various types of word square.
The constant sum in every row, column and diagonal is called the magic constant or magic sum, M. The magic constant of a normal magic square depends only on n and has the value 
M = [n((n^2) + 1) / 2]  (Posted by Jerry Yoakum)
Thus the magic square series is like this: 1, 5, 15, 34, 65, 111, 175, 260…
Often when I want to practice programing I'll write some code to calculate some interesting mathematical number or series. Recently I picked the magic square series. When I finished I noticed that for each order of magnitude beyond n = 20 there was a pattern.

Magic Square Corollary

M(n) = M(20 * 10^y) = 4000 * 10^3y + 10 * 10^y  (Posted by Jerry Yoakum)
for y = 0 to ∞

n
M(n)
20 4,010
200 4,000,100
2,000 4,000,001,000
20,000  4,000,000,010,000
... ...


This was done solely for the enjoyment of playing around with some numbers. I used Roger's Online Equation Editor to make the above equation image. Very handy tool.

Next I noticed that any value of n = 10, 20, 30, ..., 90 can have the above equation applied to it. For example, n = 10:
M(10) = 505
Split 505 at the two least significant digits. Maintain the order of the left half to get 500 and 5. Then apply those values on the left and right of the plus sign, as so:
M(n) = M(10 * 10^y) = 500*10^(3y)+5*10^y
M(100) = 500,050
M(1,000) = 500,000,500
...

M(90) = 364,545
M(n) = M(90 * 10^y) = 3,645*10^(3y)+45*10^y
M(900) = 364,500,450
M(9,000) = 364,500,004,500
...

Saturday, January 07, 2017

Avoid Numerous Special Cases

Complexity is the enemy. (Posted by Jerry Yoakum)

There are often exceptional situations to an algorithm's design. Exceptional situations cause special cases to be added to the algorithm. Every special case makes it more difficult to debug, modify, maintain, and enhance an algorithm.

If you find too many special cases, you probably have an inappropriate algorithm. Rethink and redesign the algorithm.

Wednesday, December 14, 2016

Minimize Intellectual Distance

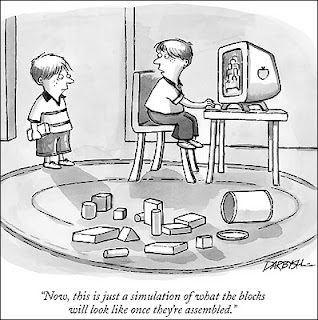
A pile of blocks lay next to a computer with an image of an assembled block building on the monitor. A boy tells another boy to keep in mind that this is just a simulation.

Edsger Dijkstra defined intellectual distance as the distance between the real-world problem and the computerized solution to that problem. Richard Fairley argues that the smaller the intellectual distance, the easier it will be to maintain the software.

To do this, the structure of the software should as closely as possible mimic the structure of the real world. You can minimize intellectual distance using any design approach. Be aware that the structure of the real-world is not unique. As pointed out so well by Jawed Siddiqi in his March 1994 article in IEEE Software, entitled "Challenging Universal Truths of Requirements Engineering," different people often perceive different structures when examining the same thing and thus construct quite diverse constructed realities.


Keep Design Under Intellectual Control

A design is under intellectual control if it has been created and documented in a manner that enables its creators and maintainers to fully understand it.

Documentation enables and enhances thought. (Posted by Jerry Yoakum)

An essential attribute of such a design is that it is constructed hierarchically and with multiple views. Hierarchies enable readers to comprehend the entire system abstractly, and then comprehend finer and finer levels of details as they move down the hierarchy. At each level the component should be described from an external point of view only. Furthermore, any single component (at any level in the hierarchy) should exhibit simplicity and elegance.